The Evidence-Based Management Guide
Guide
21 minutes to read
Last Updated: Wed 25 Oct 2023 11:15
Evidence-Based Management (EBM) is an empirical approach that helps organizations to continuously improve customer outcomes, organizational capabilities, and business results under conditions of uncertainty. It provides a framework for organizations to improve their ability to deliver value in an uncertain world, seeking a path toward strategic goals. Using intentional experimentation and evidence (measures), EBM enables organizations to systematically improve their performance over time and refine their goals based on better information By measuring current conditions, setting performance goals, forming small experiments for improvement that can be run quickly, measuring the effect of the experiment, and inspecting and adapting goals and next steps, EBM helps organizations to take into account the best available evidence to help them make decisions on ways to improve.
This Guide defines EBM, its concepts, and its application.
Seek Goals using Empiricism
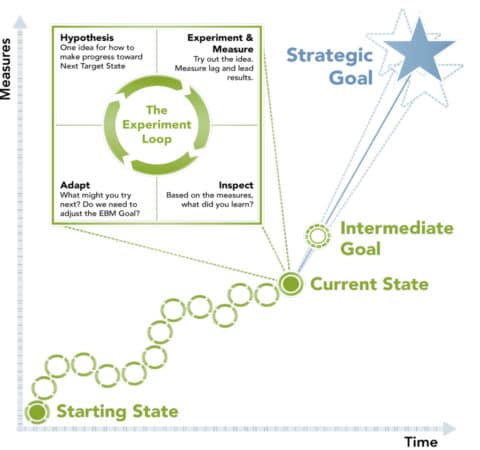
Complex problems defy easy solutions, but instead require organizations seek toward their goals in a series of small steps, inspecting the results of each step, and adapting their next actions based on feedback.
This model has several key elements:
- A Strategic Goal, which is something important that the organization would like to achieve. This goal is so big and far away, with many uncertainties along the journey that the organization must use empiricism. Because the Strategic Goal is aspirational and the path to it is uncertain, the organization needs a series of practical targets, like
- Intermediate Goals, achievements of which will indicate that the organization is on the path to its Strategic Goal. The path to the Intermediate Goal is often still somewhat uncertain, but not completely unknown.
- Immediate Tactical Goals, critical near-term objectives toward which a team or group of teams will work help toward Intermediate Goals.
- A Starting State, which is where the organization is relative to the Strategic Goal when it starts its journey.
- A Current State, which is where the organization is relative to the Strategic Goal at the present time.
In order to progress toward the Strategic Goal, organizations run experiments which involve forming hypotheses that are intended to advance the organization toward their current Intermediate Goal. As they run these experiments and gather results, they use the evidence they obtain to evaluate their goals and determine their next steps to advance toward these goals.
Setting Goals
When setting goals, organizations must define specific measures that will indicate that the goal is achieved. Goals, measures, and experiments should be made transparent in order to encourage organizational alignment. Consider the case of the response to an infectious disease:
- The Strategic Goal is to eradicate the effects of the disease, as measured by the number of people who fall ill and suffer significant illness. Measurement is important; in this example, the goal is focused on the effects of the disease, and not on the means for achieving the desired impact. For example, the goal is not to vaccinate a certain percentage of the population against the disease; that may be an activity necessary to achieving the Strategic Goal, but it is not the Strategic Goal.
- An example of an Intermediate Goal is the successful completion of a trial of a vaccine against the disease. This is still ambitious and measurable, and achieving it may require the completion of many different activities, but it is seen as a necessary step on the path to achieving the Strategic Goal. Examples of immediate tactical goals may include activities like isolating symptoms, evaluating a therapy, sequencing the DNA of a virus or bacterium, and so forth.
- The Strategic Goal is usually focused on achieving a highly desirable but unrealized outcome for a specific group of people that results in improved happiness, safety, security, or well-being of the recipients of some product or service. In EBM, we refer to this as Unrealized Value, which is the satisfaction gap between a beneficiary’s desired outcome and their current experience. Unrealized Value is described in greater detail below, in the Key-Value Areas section.
Understanding What Is Valuable
Organizations measure many different kinds of things. Broadly speaking, measures fall into three categories:
- Activities. These are things that people in the organization do, such as perform work, go to meetings, have discussions, write code, create reports, attend conferences, and so forth.
- Outputs. These are things that the organization produces, such as product releases (including features), reports, defect reports, product reviews, and so on.
- Outcomes. These are desirable things that a customer or user of a product experiences. They represent some new or improved capability that the customer or user was not able to achieve before. Examples include being able to travel to a destination faster than before or being able to earn or save more money than before. Outcomes can also be negative, as in the case where the value a customer or user experiences declines from previous experiences, for example when a service they previously relied upon is no longer available.
The problem most organizations face, which is often reflected in the things they measure, is that measuring activities and outputs is easy while measuring outcomes is difficult. Organizations may gather a lot of data with insufficient information about their ability to deliver value. However, delivering valuable outcomes to customers is essential if organizations are to reach their goals. For example, working more hours (activities) and delivering more features (outputs) does not necessarily lead to improved customer experiences (outcomes).
Four Key Value Areas
In addition to using hypotheses and experiments to move toward goals, EBM provides a set of perspectives on value and the organization’s ability to deliver value. These perspectives are called Key Value Areas (KVAs). These areas examine the goals of the organization (Unrealized Value), the current state of the organization relative to those goals (Current Value), the responsiveness of the organization in delivering value (Time-to-Market), and the effectiveness of the organization in delivering value (Ability-to-Innovate). Focusing on these four dimensions enables organizations to better understand where they are and where they need to go (see Figure 2).
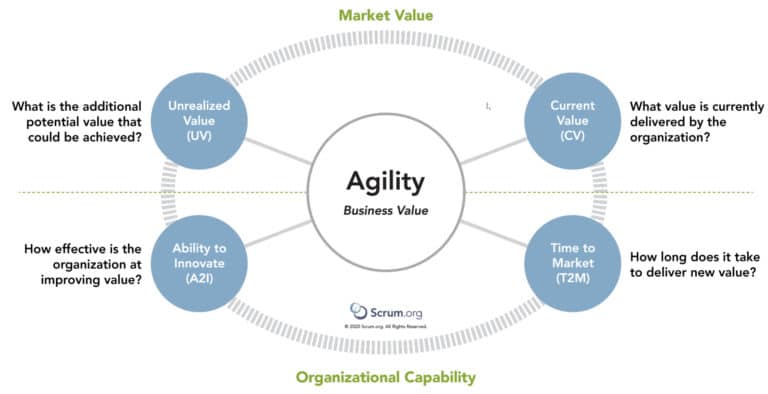
Each KVA focuses on a different aspect of either value or the ability of the organization to deliver value. Delivering business value (Current Value) is important, but organizations must also show that they can respond to change (Time-to-Market) while being able to sustain innovation over time (Ability-to-Innovate). And they must be able to continually make progress toward their long-term goals (Unrealized Value) or they risk succumbing to stagnation and complacency. Example Key Value Measures (KVMs) for each KVA are described in the Appendix.
Current Value (CV)
The value that the product delivers today.
The purpose of looking at CV is to understand the value that an organization delivers to customers and stakeholders at the present time; it considers only what exists right now, not the value that might exist in the future. Questions that organizations need to continually re-evaluate for current value are:
- How happy are users and customers today? Is their happiness improving or declining?
- How happy are your employees today? Is their happiness improving or declining?
- How happy are your investors and other stakeholders today? Is their happiness improving or declining?
Considering CV helps an organization understand the value that their customers or users experience today
Example: While profit, one way to measure investor happiness, will tell you the economic impact of the value that you deliver, knowing whether customers are happy with their purchase will tell you more about where you may need to improve to keep those customers. If your customers have few alternatives to your product, you may have high profit even though customer satisfaction is low. Considering CV from several perspectives will give you a better understanding of your challenges and opportunities. Customer happiness and investor happiness also do not tell the whole story about your ability to deliver value. Considering employee attitudes recognizes that employees are ultimately the producers of value. Engaged employees that know how to maintain, sustain and enhance the product are one of the most significant assets of an organization, and happy employees are more engaged and productive.
Unrealized Value (UV)
The potential future value that could be realized if the organization met the needs of all potential customers or users
Looking at Unrealized Value helps an organization to maximize the value that it realizes from a product or service over time. When customers, users, or clients experience a gap between their current experience and the experience that they would like to have, the difference between the two represents an opportunity; this opportunity is measured by Unrealized Value.
Questions that organizations need to continually re-evaluate for UV are:
- Can any additional value be created by our organization in this market or other markets?
- Is it worth the effort and risk to pursue these untapped opportunities?
- Should further investments be made to capture additional Unrealized Value?
The consideration of both CV and UV provides organizations with a way to balance present and possible future benefits. Strategic Goals are formed from some satisfaction gap and an opportunity for an organization to decrease UV by increasing CV.
Example: A product may have low CV, because it is an early version being used to test the market, but very high UV, indicating that there is great market potential. Investing in the product to try to boost CV is probably warranted, given the potential returns, even though the product is not currently producing high CV. Conversely, a product with very high CV, large market share, no near competitors, and very satisfied customers may not warrant much new investment; this is the classic cash cow product that is very profitable but nearing the end of its product investment cycle with low UV.
Time-to-Market (T2M)
The organization’s ability to quickly deliver new capabilities, services, or products
The reason for looking at T2M is to minimize the amount of time it takes for the organization to deliver value. Without actively managing T2M, the ability to sustainably deliver value in the future is unknown. Questions that organizations need to continually re-evaluate for T2M are:
- How fast can the organization learn from new experiments and information?
- How fast can you adapt based on the information?
- How fast can you test new ideas with customers?
Improving T2M helps improve the frequency at which an organization can potentially change CV.
Example: Reducing the number of features in a product release can dramatically improve T2M; the smallest release possible is one that delivers at least some incremental improvement in value to some subset of the customers/users of the product. Many organizations also focus on removing non value-added activities from the product development and delivery process to improve their T2M.
Ability to Innovate (A2I)
The effectiveness of an organization to deliver new capabilities that might better meet customer needs
The goal of looking at the A2I is to maximize the organization’s ability to deliver new capabilities and innovative solutions. Organizations should continually re-evaluate their A2I by asking:
- What prevents the organization from delivering new value?
- What prevents customers or users from benefiting from that innovation?
- Improving A2I helps an organization become more effective in ensuring that the work that it does improves the value that its products or services deliver to customers or users.
Example: A variety of things can impede an organization from being able to deliver new capabilities and value: spending too much time remedying poor product quality, needing to maintain multiple variations of a product due to lack of operational excellence, lack of decentralized decision-making, inability to hire and inspire talented, passionate team members, and so on. As low-value features and systemic impediments accumulate, more budget and time is consumed maintaining the product or overcoming impediments, reducing its available capacity to innovate. In addition, anything that prevents users or customers from benefiting from innovation, such as hard to assemble/install products or new versions of products, will also reduce A2I.
Progress toward Goals
The first step in the journey toward a Strategic Goal is understanding your Current State. If your focus is to achieve a Strategic Goal related to Unrealized Value (UV), as is typically the case, then measuring the Current Value (CV) your product or service delivers is where you should start (of course, if your product or service is new then its CV will be zero). To understand where you need to improve, you may also need to understand your effectiveness (A2I), and your responsiveness (T2M).
The Experiment Loop (shown in Figure 1) helps organizations move from their Current State toward their Next Target Goal, and ultimately their Strategic Goal, by taking small, measured steps, called experiments, using explicit hypotheses.3 This loop consists of:
- Forming a hypothesis for improvement. Based on experience, form an idea of something you think will help you move toward your Next Target Goal, and decide how you will know whether this experiment succeeded based on measurement.
- Running your experiments. Make the change you think will help you to improve and gather data to support or refute your hypothesis.
- **Inspecting your results. **Did the change you made improve your results based on the measurements you have made? Not all changes do; some changes actually make things worse.
- Adapting your goals or your approach based on what you learned. Both your goals and your improvement experiments will likely evolve as you learn more about customers, competitors, and your organization’s capabilities. Goals can change because of outside events, and your tactics to reach your goals may need to be reconsidered and revised. Was the Intermediate Goal the right goal? Is the Strategic Goal still relevant? If you achieved the Intermediate Goal, you will need to choose a new Intermediate Goal. If you did not achieve it, you will need to decide whether you need to persevere, stop, or pivot toward something new. If your Strategic Goal is no longer relevant, you will need to either adapt it, or replace it.
Hypotheses, Experiments, Features, and Requirements
Features are “distinguishing characteristics of a product” , while a requirement is, practically speaking, something that someone thinks would be desirable in a product. A feature description is one kind of requirement.
Organizations can spend a lot of money implementing features and other requirements in products, only to find that customers don’t share the company’s opinion on their value; beliefs in what is valuable are merely assumptions until they are validated by customers. This is where hypotheses and experiments are useful.
In simplified terms, a hypothesis is a proposed explanation for some observation that has not yet been proven (or disproven). In the context of requirements, it is a belief that doing something will lead to something else, such as delivering feature X will lead to outcome Y. An experiment is a test that is designed to prove or reject some hypothesis.
Every feature and every requirement really represent a hypothesis about value. One of the goals of an empirical approach is to make these hypotheses explicit and to consciously design experiments that explicitly test the value of the features and requirements. The entire feature or requirement need not actually be built to determine whether it is valuable; it may be sufficient for a team to simply build enough of it to validate critical assumptions that would prove or disprove its value.
Explicitly forming hypotheses, measuring results, and inspecting and adapting goals based on those results are implicit parts of an agile approach. Making this work explicit and transparent is what EBM adds to the organizational improvement process.
End Note
Evidence-Based Management is free and offered in this Guide. Although implementing only parts of EBM is possible, the result is not Evidence-Based Management
Acknowledgements
Evidence-Based Management was collaboratively developed by Scrum.org, the Professional Scrum Trainer community, Ken Schwaber and Christina Schwaber.
Appendix: Example Key Value Measures
To encourage adaptability, EBM defines no specific Key Value Measures (KVMs). KVMs listed below are presented to show the kinds of measures that might help an organization to understand its current state, desired future state, and factors that influence its ability to improve.
Current Value (CV)
| KVM | Measuring |
|---|---|
| Revenue per Employee | The ratio (gross revenue / # of employees) is a key competitive indicator within an industry. This varies significantly by industry. |
| Product Cost Ratio | Total expenses and costs for the product(s)/system(s) being measured, including operational costs compared to revenue. |
| Employee Satisfaction | Some form of sentiment analysis to help gauge employee engagement, energy, and enthusiasm. |
| Customer Satisfaction | Some form of sentiment analysis to help gauge customer engagement and happiness with the product. |
| Customer Usage Index | Measurement of usage, by feature, to help infer the degree to which customers find the product useful and whether actual usage meets expectations on how long users should be taking with a feature. |
Unrealized Value (UV)
| KVM | Measuring |
|---|---|
| Market Share | The relative percentage of the market not controlled by the product; the potential market share that the product might achieve if it better met customer needs. |
| Customer or User Satisfaction Gap | The difference between a customer or user’s desired experience and their current experience. |
| Desired Customer Experience or satisfaction | A measure that indicates the experience that the customer would like to have. |
Time-to-Market (T2M)
| KVM | Measuring |
|---|---|
| Build and Integration Frequency | The number of integrated and tested builds per time period. For a team that is releasing frequently or continuously, this measure is superseded by actual release measures. |
| Release Frequency | The number of releases per time period, e.g. continuously, daily, weekly, monthly, quarterly, etc. This helps reflect the time needed to satisfy the customer with new and competitive products. |
| Release Stabilization Period | The time spent correcting product problems between the point the developers say it is ready to release and the point where it is actually released to customers. This helps represent the impact of poor development practices and underlying design and codebase. |
| Mean Time to Repair | The average amount of time it takes from when an error is detected and when it is fixed. This helps reveal the efficiency of an organization to fix an error. |
| Customer Cycle Time | The amount of time from when work starts on a release until the point where it is actually released. This measure helps reflect an organization’s ability to reach its customer. |
| Lead Time | The amount of time from when an idea is proposed or a hypothesis is formed until a customer can benefit from that idea. This measure may vary based on customer and product. It is a contributing factor in customer satisfaction. |
| Lead Time for Changes | The amount of time to go from code-committed to code successfully running in production. For more information, see the DORA 2019 report. |
| Deployment Frequency | The number of times that the organization deployed (released) a new version of the product to customers/users. For more information, see the DORA 2019 report. |
| Time to Restore Service | The amount of time between the start of a service outage and the restoration of full availability of the service. For more information, see the DORA 2019 report. |
| Time-to-Learn | The total time needed to sketch an idea or improvement, build it, deliver it to users, and learn from their usage. |
| Time to remove Impediment | The average amount of time from when an impediment is raised until when it is resolved. It is a contributing factor to lead time and employee satisfaction |
| Time to Pivot | A measure of true business agility that presents the elapsed time between when an organization receives feedback or new information and when it responds to that feedback; for example, the time between when it finds out that a competitor has delivered a new market-winning feature to when the organization responds with matching or exceeding new capabilities that measurably improve customer experience. |
Ability to Innovate (A2I)
| KVM | Measuring |
|---|---|
| Innovation Rate | The percentage of effort or cost spent on new product capabilities, divided by total product effort or cost. This provides insight into the capacity of the organization to deliver new product capabilities. |
| Defect Trends | Measurement of change in defects since the last measurement. A defect is anything that reduces the value of the product to a customer, user, or to the organization itself. Defects are generally things that don’t work as intended. |
| On-Product Index | The percentage of time teams spend working on product and value. |
| Installed Version Index | The number of versions of a product that are currently being supported. This reflects the effort the organization spends supporting and maintaining older versions of the software. |
| Technical Debt | A concept in programming that reflects the extra development and testing work that arises when “quick and dirty” solutions result in later remediation. It creates an undesirable impact on the delivery of value and an avoidable increase in waste and risk. |
| Production Incident Count | The number of times in a given period that the Development Team was interrupted to fix a problem in an installed product. The number and frequency of Production Incidents can help indicate the stability of the product. |
| Active Product (Code) Branches | The number of different versions (or variants) of a product or service. Provides insight into the potential impact of change and the resulting complexity of work. |
| Time Spent Merging Code Between Branches | The amount of time spent applying changes across different versions of a product or service. Provides insight into the potential impact of change and the resulting complexity of work. |
| Time Spent Context-Switching | Examples include time lost to interruptions caused by meetings or calls, time spent switching between tasks, and time lost when team members are interrupted to help people outside the team can give simple insight into the magnitude of the problem. |
| Change Failure Rate | The percentage of released product changes that result in degraded service and require remediation (e.g. hotfix, rollback, patch). For more information, see the DORA 2019 report. |
© 2020 Scrum.org This publication is offered for license under the Attribution Share-Alike license of Creative Commons, accessible at http://creativecommons.org/licenses/by-sa/4.0/legalcode and also described in summary form at http://creativecommons.org/licenses/by-sa/4.0/. By utilizing this EBM Guide, you acknowledge and agree that you have read and agree to be bound by the terms of the Attribution Share-Alike license of Creative Commons.